This document describes an older version of Celery (2.2). For the latest stable version please go here.
Monitoring and Management Guide
Introduction
There are several tools available to monitor and inspect Celery clusters.
This document describes some of these, as as well as features related to monitoring, like events and broadcast commands.
Workers
celeryctl: Management Utility
New in version 2.1.
celeryctl is a command line utility to inspect and manage worker nodes (and to some degree tasks).
To list all the commands available do:
$ celeryctl help
or to get help for a specific command do:
$ celeryctl <command> --help
Commands
- status: List active nodes in this cluster
$ celeryctl status
- result: Show the result of a task
$ celeryctl result -t tasks.add 4e196aa4-0141-4601-8138-7aa33db0f577
Note that you can omit the name of the task as long as the task doesn’t use a custom result backend.
- purge: Purge messages from all configured task queues.
$ celeryctl purge
Warning
There is no undo for this operation, and messages will be permanently deleted!
- inspect active: List active tasks
$ celeryctl inspect active
These are all the tasks that are currently being executed.
- inspect scheduled: List scheduled ETA tasks
$ celeryctl inspect scheduled
These are tasks reserved by the worker because they have the eta or countdown argument set.
- inspect reserved: List reserved tasks
$ celeryctl inspect reserved
This will list all tasks that have been prefetched by the worker, and is currently waiting to be executed (does not include tasks with an eta).
- inspect revoked: List history of revoked tasks
$ celeryctl inspect revoked
- inspect registered_tasks: List registered tasks
$ celeryctl inspect registered_tasks
- inspect stats: Show worker statistics
$ celeryctl inspect stats
- inspect enable_events: Enable events
$ celeryctl inspect enable_events
- inspect disable_events: Disable events
$ celeryctl inspect disable_events
Note
All inspect commands supports a --timeout argument, This is the number of seconds to wait for responses. You may have to increase this timeout if you’re not getting a response due to latency.
Specifying destination nodes
By default the inspect commands operates on all workers. You can specify a single, or a list of workers by using the –destination argument:
$ celeryctl inspect -d w1,w2 reserved
Django Admin Monitor
New in version 2.1.
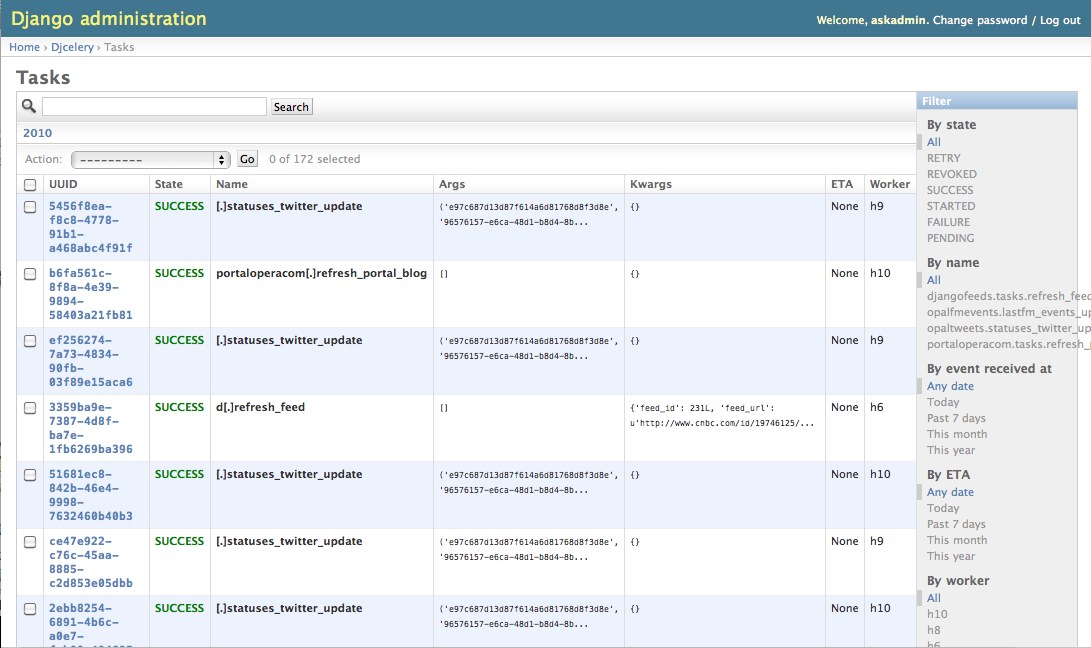
When you add django-celery to your Django project you will automatically get a monitor section as part of the Django admin interface.
This can also be used if you’re not using Celery with a Django project.
Screenshot
Starting the monitor
The Celery section will already be present in your admin interface, but you won’t see any data appearing until you start the snapshot camera.
The camera takes snapshots of the events your workers sends at regular intervals, storing them in your database (See Snapshots).
To start the camera run:
$ python manage.py celerycam
If you haven’t already enabled the sending of events you need to do so:
$ python manage.py celeryctl inspect enable_events
| Tip: | You can enable events when the worker starts using the -E argument to celeryd. |
|---|
Now that the camera has been started, and events have been enabled you should be able to see your workers and the tasks in the admin interface (it may take some time for workers to show up).
The admin interface shows tasks, worker nodes, and even lets you perform some actions, like revoking and rate limiting tasks, or shutting down worker nodes.
Shutter frequency
By default the camera takes a snapshot every second, if this is too frequent or you want to have higher precision, then you can change this using the --frequency argument. This is a float describing how often, in seconds, it should wake up to check if there are any new events:
$ python manage.py celerycam --frequency=3.0
The camera also supports rate limiting using the --maxrate argument. While the frequency controls how often the camera thread wakes up, the rate limit controls how often it will actually take a snapshot.
The rate limits can be specified in seconds, minutes or hours by appending /s, /m or /h to the value. Example: --maxrate=100/m, means “hundred writes a minute”.
The rate limit is off by default, which means it will take a snapshot for every --frequency seconds.
The events also expire after some time, so the database doesn’t fill up. Successful tasks are deleted after 1 day, failed tasks after 3 days, and tasks in other states after 5 days.
Using outside of Django
django-celery also installs the djcelerymon program. This can be used by non-Django users, and runs both a web server and a snapshot camera in the same process.
Installing
Using pip:
$ pip install -U django-celery
or using easy_install:
$ easy_install -U django-celery
Running
djcelerymon reads configuration from your Celery configuration module, and sets up the Django environment using the same settings:
$ djcelerymon
Database tables will be created the first time the monitor is run. By default an sqlite3 database file named djcelerymon.db is used, so make sure this file is writeable by the user running the monitor.
If you want to store the events in a different database, e.g. MySQL, then you can configure the DATABASE* settings directly in your Celery config module. See http://docs.djangoproject.com/en/dev/ref/settings/#databases for more information about the database options available.
You will also be asked to create a superuser (and you need to create one to be able to log into the admin later):
Creating table auth_permission
Creating table auth_group_permissions
[...]

You just installed Django's auth system, which means you don't
have any superusers defined.  Would you like to create
one now? (yes/no): yes
Username (Leave blank to use 'username'): username
E-mail address: me@example.com
Password: ******
Password (again): ******
Superuser created successfully.

[...]
Django version 1.2.1, using settings 'celeryconfig'
Development server is running at http://127.0.0.1:8000/
Quit the server with CONTROL-C.
Now that the service is started you can visit the monitor at http://127.0.0.1:8000, and log in using the user you created.
For a list of the command line options supported by djcelerymon, please see djcelerymon --help.
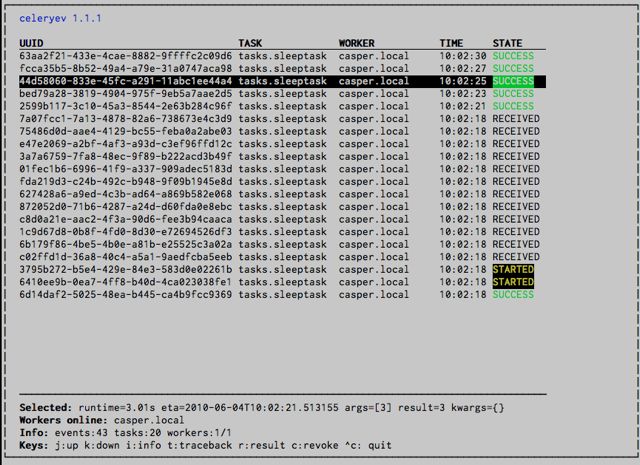
celeryev: Curses Monitor
New in version 2.0.
celeryev is a simple curses monitor displaying task and worker history. You can inspect the result and traceback of tasks, and it also supports some management commands like rate limiting and shutting down workers.
celeryev is also used to start snapshot cameras (see Snapshots:
$ celeryev --camera=<camera-class> --frequency=1.0
and it includes a tool to dump events to stdout:
$ celeryev --dump
For a complete list of options use --help:
$ celeryev --help
celerymon: Web monitor
celerymon is the ongoing work to create a web monitor. It’s far from complete yet, and does currently only support a JSON API. Help is desperately needed for this project, so if you, or someone you know would like to contribute templates, design, code or help this project in any way, please get in touch!
| Tip: | The Django admin monitor can be used even though you’re not using Celery with a Django project. See Using outside of Django. |
|---|
RabbitMQ
To manage a Celery cluster it is important to know how RabbitMQ can be monitored.
RabbitMQ ships with the rabbitmqctl(1) command, with this you can list queues, exchanges, bindings, queue lengths, the memory usage of each queue, as well as manage users, virtual hosts and their permissions.
Note
The default virtual host ("/") is used in these examples, if you use a custom virtual host you have to add the -p argument to the command, e.g: rabbitmqctl list_queues -p my_vhost ....
Inspecting queues
Finding the number of tasks in a queue:
$ rabbitmqctl list_queues name messages messages_ready \
                          messages_unacknowlged
Here messages_ready is the number of messages ready for delivery (sent but not received), messages_unacknowledged is the number of messages that has been received by a worker but not acknowledged yet (meaning it is in progress, or has been reserved). messages is the sum of ready and unacknowledged messages.
Finding the number of workers currently consuming from a queue:
$ rabbitmqctl list_queues name consumers
Finding the amount of memory allocated to a queue:
$ rabbitmqctl list_queues name memory
| Tip: | Adding the -q option to rabbitmqctl(1) makes the output easier to parse. |
|---|
Munin
This is a list of known Munin plug-ins that can be useful when maintaining a Celery cluster.
rabbitmq-munin: Munin plug-ins for RabbitMQ.
celery_tasks: Monitors the number of times each task type has been executed (requires celerymon).
celery_task_states: Monitors the number of tasks in each state (requires celerymon).
Events
The worker has the ability to send a message whenever some event happens. These events are then captured by tools like celerymon and celeryev to monitor the cluster.
Snapshots
Even a single worker can produce a huge amount of events, so storing the history of all events on disk may be very expensive.
A sequence of events describes the cluster state in that time period, by taking periodic snapshots of this state we can keep all history, but still only periodically write it to disk.
To take snapshots you need a Camera class, with this you can define what should happen every time the state is captured; You can write it to a database, send it by e-mail or something else entirely.
celeryev is then used to take snapshots with the camera, for example if you want to capture state every 2 seconds using the camera myapp.Camera you run celeryev with the following arguments:
$ celeryev -c myapp.Camera --frequency=2.0
Custom Camera
Here is an example camera, dumping the snapshot to screen:
from pprint import pformat

from celery.events.snapshot import Polaroid


class DumpCam(Polaroid):

    def shutter(self, state):
        if not state.event_count:
            # No new events since last snapshot.
            return
        print("Workers: %s" % (pformat(state.workers, indent=4), ))
        print("Tasks: %s" % (pformat(state.tasks, indent=4), ))
        print("Total: %s events, %s tasks" % (
            state.event_count, state.task_count))
See the API reference for celery.events.state to read more about state objects.
Now you can use this cam with celeryev by specifying it with the -c option:
$ celeryev -c myapp.DumpCam --frequency=2.0
Or you can use it programmatically like this:
from celery.events import EventReceiver
from celery.messaging import establish_connection
from celery.events.state import State
from myapp import DumpCam

def main():
    state = State()
    with establish_connection() as connection:
        recv = EventReceiver(connection, handlers={"*": state.event})
        with DumpCam(state, freq=1.0):
            recv.capture(limit=None, timeout=None)

if __name__ == "__main__":
    main()
Event Reference
This list contains the events sent by the worker, and their arguments.
Task Events
task-received(uuid, name, args, kwargs, retries, eta, hostname, timestamp)
Sent when the worker receives a task.
task-started(uuid, hostname, timestamp, pid)
Sent just before the worker executes the task.
task-succeeded(uuid, result, runtime, hostname, timestamp)
Sent if the task executed successfully.
Runtime is the time it took to execute the task using the pool. (Starting from the task is sent to the worker pool, and ending when the pool result handler callback is called).
task-failed(uuid, exception, traceback, hostname, timestamp)
Sent if the execution of the task failed.
task-revoked(uuid)
Sent if the task has been revoked (Note that this is likely to be sent by more than one worker).
task-retried(uuid, exception, traceback, hostname, timestamp)
Sent if the task failed, but will be retried in the future.
Worker Events
worker-online(hostname, timestamp, sw_ident, sw_ver, sw_sys)
The worker has connected to the broker and is online.
- sw_ident: Name of worker software (e.g. celeryd).
- sw_ver: Software version (e.g. 2.2.0).
- sw_sys: Operating System (e.g. Linux, Windows, Darwin).
worker-heartbeat(hostname, timestamp, sw_ident, sw_ver, sw_sys)
Sent every minute, if the worker has not sent a heartbeat in 2 minutes, it is considered to be offline.
worker-offline(hostname, timestamp, sw_ident, sw_ver, sw_sys)
The worker has disconnected from the broker.
